What's Your Perfect Order?

by Howard Coleman
You have a 99 percent fill rate from your distribution center/warehouse. Is this good? What is good when it comes to measuring distribution performance? Is it the ultimate measure of the life of a customer’s order? Can you capture every step in the life of a customer’s order? Can you measure the errors per order line?
The journey of product through any supply chain to a customer is filled with constant movement and activity. Each step holds the potential for delays, wasted money and errors. The odds against fulfilling a perfect order are high and, of course, depend on the complexities of your supply chain as well as your company’s emphasis (whether you compete on service or compete on price).
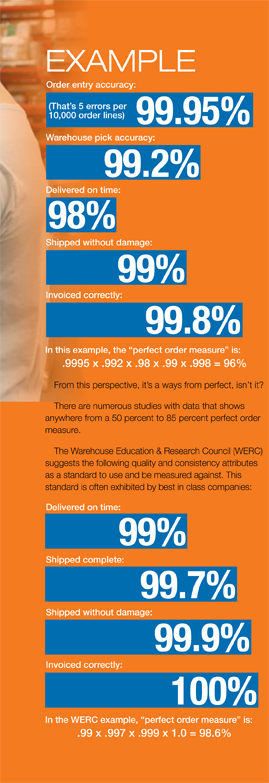
 Failure to meet just one predefined condition (measurement) results in less than a perfect order. Many companies today that possess the highest perfect order rates boast of carrying less inventory, experience shorter cash-to-cash cycle times, and have significantly fewer stock-outs than their competitors.
Let’s look at what happens when an error occurs. Say, for example, that your warehouse picks and ships the wrong item. Once the customer receives the order and notices the error, they typically make contact to notify you of the mistake.
You, in turn, make some adjustment. You accept a return, issue a credit, issue a correcting invoice, etc. Obviously there are physical costs to fix the error and a potential for lost sales or customers. Physical costs might include labor for multiple shipments, providing replacement product, refunds, issuing credits and the like.
It is through this correction process that you can begin to derive your perfect order measure. Most often, you will use a “reason code” in your ERP for this purpose. Tracking the reason code and assigning it to a category allows you to group them together for a perfect order measure. Of course, there is other data required that is not related directly to invoice adjustments.
Note: AMR Research Inc. found a correlation in some key financial indicators, including that a three percentage point better perfect order measure correlated to 1 percent additional profit margin!
Whatever attributes you choose, you might conclude that there is an advantage to looking at the overall impact of the measurement elements, rather than looking at each metric individually. Of course, you can always drill down as necessary to determine what’s up with the individual factors.
Some companies have developed perfect order measures based on customer segmentation, meaningful categories, such as a customer’s contribution to profits or cost to serve. This can better align the dedication of resources to clearly set organizational priorities.
To me, this discussion only enhances the importance of maintaining a high focus on “The Imperative of Operational Excellence” (request our recent article at: hcoleman@mcaassociates.com).
Improvement in performance is driven, in large part, by implementing improved processes. The process begins with determining which key performance indicators are most important to your business model, analyzing the relationship between those measures and using the analysis to help drive process improvement, where needed.
 Howard W. Coleman is principal of MCA Associates, a management consulting firm that works with wholesale distribution and manufacturing companies seeking operational excellence. MCA provides operational excellence – thought leadership – and implements continuous improvement solutions focused on business process re-engineering, inventory and supply chain management, sales development and revenue generation, information systems and technology, organizational assessment and development and family-business succession planning. Phone (203) 732-0603, or email hcoleman@mcaassociates.com.
This article originally appeared in the July/August 2017 issue of Industrial Supply magazine. Copyright 2017, Direct Business Media.


