

Vendor funds and the assisted sale

by Scott Benfield
At its most elementary level, wholesale distribution is a business with a single directive: buy low and sell high. The sector is known for thin bottom-line margins that range between 2 percent to 5 percent return on sales (ROS). Competitive buying is fundamental to financial health. Many wholesalers, especially small and mid-range firms, are members of cooperatives that collectively leverage buying relationships with vendors. Recently, the necessity of cooperative relationships was in the news as smaller cooperatives were consolidated into both Affiliated Distributors and I-Mark. The consolidation signals the power of the aggregated buy and the need for distributors to pool funds to develop e-commerce content and software.
Our recent work and research (Summer/Fall 2018) have found an area of channel management that, for all intents and purposes, has been underexplored and undermanaged but can drive acceptable profit and sales growth. It is the area of vendor funds including monies known as volume rebates, special pricing allowances (SPAs), marketing development funds (MDF), and co-op funds. Because there has been limited research on these funds, in the Summer of 2018, Benfield Consulting, Channel Marketing Group and Industrial Supply magazine researched the impact of these funds on the modern B2B supply chain. The results were surprising and lead us to believe that distributors will need to mine the subject matter to remain competitive, especially as
e-commerce grows.
E-Commerce and the Assisted Sale
E-commerce, today, represents approximately 12 percent of all B2B sales, or $1 trillion in total volume. Our research in MRO/Industrial/Contractor based distribution finds that e-commerce sales are slightly higher at 15 percent to 17 percent of all sales and grows at approximately 8 percent per year. By 2025, a quarter of sales will be online and a third will be online by 2030. As e-commerce has grown, so have the available product sources for the distributor customer. Yesteryear’s customers gained two to three viable sources of similar product, price and availability via email or phone. Today’s customer has three times as many sources, and many are non-traditional distributor suppliers including made-for-internet suppliers such as Zoro Tool (www.zoro.com) and Sustainable Supply (www.sustainablesupply.com). Recent research finds that these made-for-e-commerce firms represent only 17 percent of the supply base but account for 47 percent of all online transactions. The upshot is that there are a significant number of competitors for distributor sales that are easily searched online. To compensate for the increase in competition, distributors sought to leverage their vendor relationships by securing financial help to consummate the sale.
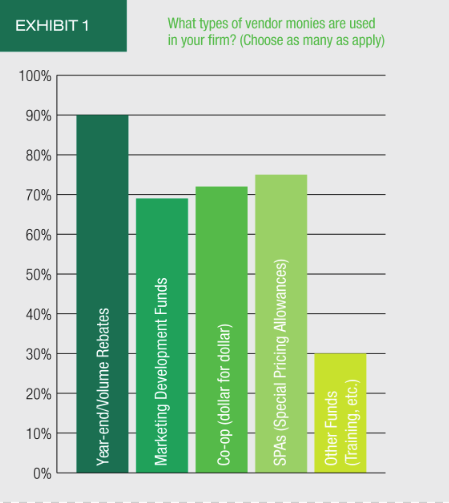 Vendor financial help has, for decades, been available in the form of manufacturer funds. What’s different, in the current day, are the increased usage of these funds. In Exhibit 1, we find that of the four categories of vendor funds, volume rebates are the most common, with 90 percent of distributors using these funds. Vendor rebates show a high preference by distributor executives in that they are considered “sheltered income” falling to the bottom line. SPAs are used by 77 percent of distributors and are growing in usage more than other fund types. Co-op and marketing development funds are used by 72 percent and 68 percent of distributors, respectively. SPAs, co-op, and marketing development funds are termed “Front-Door” funds and support a growing class of transactions called “Assisted Sales.” Assisted Sales are distributor customer requests that need vendor assistance to successfully land the sale. Our research finds that Assisted Sales are growing in usage, as 40 percent of distributor executives believe their volume will increase in the future.
We measured the amount of funds used by comparing them to annual cost of goods sold (COGS). The denominator of annual COGS was needed to normalize the responses and allow comparison among respondents. Our findings using this measure were surprising. In Exhibit 2, we review fund category usage as a percent of COGS. We arranged the responses into three groups: Top Performers, Average Performers and Below Average Performers. For instance, in Year End Rebates, Top Performers secured funds at 3.5 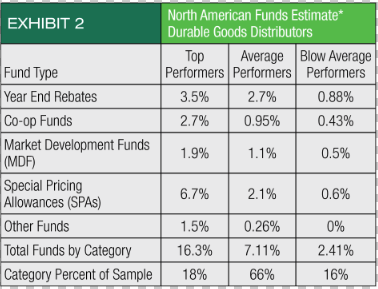 percent COGS, Average Performers at 2.7 percent and Below Average Performers at .88 percent. For SPAs, Top Performers used 6.7 percent of COGS compared to Average Performers at 2.1 percent and Below Average Performers at .6 percent. Totaling all fund types, Top Performers use 16.3 percent of funds as a percent of COGS compared to Average Performers at 7.11 percent and Below Average at 2.41 percent. As the ROS for most distributors is in the 3 percent to 5 percent range, the differential between Top and Average Performers of 9 percent COGS (16 percent – 7 percent) confers competitive advantage. Front door funds of MDF and co-op are an offset to expenses and fund an identified marketing event, while SPAs fund a competitive sale. SPAs are the funds that show the highest usage of Top Performers at 6.7 percent of COGS and a full 4.6 percent more than Average Performers.
When we total all Front Door funds (Co-op, SPA, MDF, Other) for Top Performers and add a 25 percent average margin, these funds account for 17 percent of top-line sales, compared to 6 percent of sales for Average Performers. In essence, Top Performers have Assisted Sales that are 9 percent greater than Average Performers; a statistic that likely does not go unnoticed by their suppliers.
 What Makes Top Fund Performance
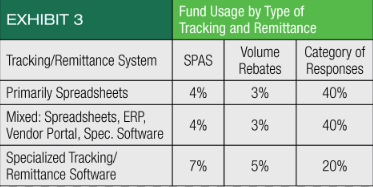
The significant differences in fund usage were surprising and we researched the usual suspects of management attention to fund expenditures, type of industry, size of distributor in revenues, and types of fund processing. We found no differences in type of industry or management attention regarding fund expenditures. Electrical distributors used no more in funds than MRO distributors or PHCP distribution firms. Regardless if management testified to paying significant attention to fund usage or used funds as they became available, there were no differences in fund expenditures. Finally, firm size had some influence on fund expenditures, with larger firms (more than $500 million in sales), spending more than mid-sized or smaller firms but this was also a function of their technology. Exhibit 3 shows the three primary ways of tracking remittance of funds including: those who primarily use spreadsheets; companies that use a mix of spreadsheets, ERP, vendor portal, remittance/tracking software; and specialized tracking/remittance software. We looked at the funds of SPAs and Vendor Rebates as a percent of COGS and found the following:
- Primarily spreadsheets represented 40 percent of tracking/remittance and yielded 4 percent SPAs and 3 percent vendor rebates as percent of COGS
- Mixed methods of spreadsheets, vendor portal, ERP, etc. yielded the same as primarily spreadsheets
- Specialized tracking and remittance software yielded 7 percent SPAs and 5 percent volume rebates
Specialized tracking and remittance software is relatively new to wholesale distribution with only 20 percent of firms having it in place. However, it yields a full 5 percent more in total SPA and Volume Rebates as a percent of sales. Why would specialized software yield substantially more in vendor monies than other methods? The answer is unknown, however, based on our work in other managerial disciplines where bolt-on software has been used to improve results, the observations are:
- Software creates a firm-wide process discipline where error is minimized and can be pinpointed
- Software gives visibility across the firm for what is happening. Visibility can increase participation such as for SPAs
- Software allows performance statistics to be captured and placed into a dashboard for management insight and management-led improvement
The usage of vendor funds is expected to increase as e-commerce creates more competition; this is especially true for SPAs. We believe the usage of bolt-on software for fund tracking and remittance will grow as vendor funds become increasingly important to top-line growth.
Summation
Vendor funds for sales and market growth are a decades-old subject area where research and bench-marking has been, largely, non-existent. Our 2018 research finds that vendor monies are substantial, upwards of 17 percent of COGS, for Top Performers and enough to provide competitive advantage. Fund growth, for Front Door funds, will increase as e-commerce grows. Distributors that use specialized funds tracking and remittance software will win sales.
 Scott Benfield is a consultant for B2B markets. He can be reached at Scott@BenfieldConsulting.com or (630) 428-9311.
This article originally appeared in the Jan./Feb. 2019 issue of Industrial Supply magazine. Copyright 2019, Direct Business Media.
INDUSTRIAL SUPPLY MAGAZINE


The May/June issue of Industrial Supply magazine features an in-depth cover story about GHX Industrial. Plus, we're featuring articles by contributing writers Dr. Bharani Nagarathnam and Frank Hurtte, as well as interviews with numerous product and distribution industry experts.