The danger of the satisfied customer
The danger of the satisfied customer is the satisfied distributor
By Chuck Holmes
Many distributors are not fond of customer satisfaction surveys. If the responses are good, they just confirm what the distributor already believes. If they’re bad, there’s usually a good explanation – very often that the customer is one of those people who just cannot be pleased.
Distributors also talk about the well-known deficiencies in the typical customer satisfaction survey: employees and friends of employees gaming the system, the low percentage of responses, a disproportionate number of responses from the very happy or the very unhappy. All of these deficiencies exist in almost all customer satisfaction surveys.
Besides, when distributors talk with their customers, the customers seemed to be satisfied.
The good news is that most of your customers are satisfied. The bad news is that being satisfied is not enough to keep them from defecting and being the satisfied customer of another distributor. In other words, the difference between a committed customer and one who’s just waiting for a better deal is not that they don’t like you, it’s that they don’t love you.
At least that’s what the analysis of about 20,000 customer satisfaction responses indicates, and that conclusion fits what other researchers have found over the last 40 or more years. The survey, sponsored by a manufacturer and administered through its distributors, measured the overall purchase experience and four specific components on a seven-point scale.
The litmus test – the difference between a committed or loyal customer and one who is not – was a “loyalty” question, a variation on Fredrick Reicheld’s “net promoter score.” According to Reicheld, the best measure of customer loyalty is a single question: On a scale of zero to 10, how likely is it that you would recommend us to your friends or colleagues? Since it was introduced in a 2004 issue of the Harvard Business Review, a number of very large companies, including General Electric and American Express, have adopted the “net promoter score” as their basic customer satisfaction tool. In this survey, the customer was asked to choose an answer from a four-point scale: Definitely, Probably, Probably Not, or No.
Predictably, the great majority of customers – more than 90% – said that they would definitely recommend the distributor. A very small percentage said that they would probably not or would not recommend the company.
The analysis of both the top and the bottom groups is not very instructive. We can suspect the top group is somewhat inflated because – at least in some cases – counter personnel or inside sales conducted the survey immediately after the sale, possibly causing the customer to give the most positive answer just to terminate the conversation.
Those in the bottom groups don’t leave a lot of room for analysis either. In fact, some distributor personnel probably knew that the customer would not recommend the company long before a survey card was returned; they heard the door slamming when the customer left.
However, there’s a fairly sizable group remaining – approximately 5% of the sample – that clearly demonstrates the difference between the committed and the not-committed customer. These are the respondents who said that they would “probably” recommend the distributor. Left unsaid was the implication that the distributor probably shouldn’t hold his breath.
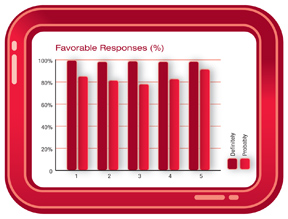
Two of the more common ways of analyzing the data don’t show a lot of difference. For instance, the average (based on the seven-point scale) for the “probablies” was between 5.24 and 5.7 on the five questions, roughly one point lower than those who would certainly recommend the distributor. In terms of the percentage of positive responses, the “certains” were in the high nineties, and the “probablies” were in the 80s. Certainly a difference, but not terribly dramatic.
At this point, the distributor – who certainly has many things to worry about other than the exact degree of happiness the customer is experiencing – may want to go back to what was considered in the first paragraph: my customers are satisfied.
Unfortunately, that path leads to lost customers. Xerox, in a much-cited study, found that the customers that rated it at the top of the scale (totally satisfied) were six times more likely to purchase from them again over the next 18 months than those in the “satisfied-but-not-totally” group.
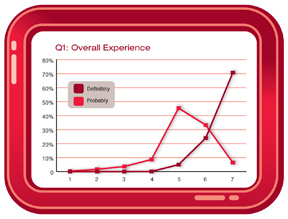
The same pattern was true in this group. In the group that would “certainly” recommend the distributor, more than 70% rated their overall experience as a “7” (the top choice). In the “probably” group fewer than 10% chose the top rating. That’s the pattern of responses for all five questions.
So why are these satisfied customers at risk?
 |
 |
Years ago, the SBA published a study showing that almost 70% of defecting customers left simply because they didn’t like the way they were treated. It wasn’t a big problem that caused them to leave, but an accumulation of small irritants. The comments from the “Probably” group indicate what these irritants might be:
- Had to call back.
- The phone rings entirely too many times.
- I hate calling and speaking to voice mail.
- Didn’t tell me the delivery was going to be late.
- They don’t return calls.
- Often don’t have what I need in stock.
- It was invoiced wrong.
The comments and the respondent’s answer to the loyalty question indicate that these problems, as picky as they might be, were sufficient to make the customer question his relationship with the distributor.
What’s a distributor to do?
However, there is something you can do, and it’s not that hard. Here’s a three-step process.
1. Do a customer satisfaction survey. That’s an obvious first step. The survey can either be transactional (the customer is asked to respond after every transaction) or periodic (conducted one to four times a year). For most distributors, transactional surveys get a lot of responses from a few customers and create customer fatigue fairly quickly. The periodic survey, once or twice a year, is often the better option.
The survey can be done by phone, mail or on the Internet. The phone survey, conducted by a third party, will most likely provide the most accurate sample; the Internet-based survey will be the least expensive. The mail survey provides the worst of both worlds: a nonrandom sample for which you pay the postage both ways.
Customer satisfaction surveys don’t have to be long or complicated to be successful. The one cited in this article has five questions: the overall experience and four elements of that experience. It also contained the loyalty question and blanks for the name and phone number. Although the name/phone number area was marked optional, more than half of the respondents provided that information.
2. Analyze the results. Although people who do surveys professionally like to provide pounds of paper covered with statistics, there’s only one number you should be really interested in: how many people selected the top choice on each question as a percentage of the total sample on each question.
3. Follow-up. Since what you have at this point is an analysis of possible symptoms, the next step is to determine the actual problem, either by talking to customers who chose something other than the top choice on one or more questions, or by implementing some sort of data gathering system, such as a lost sales log.
It is said that a wise man knows what he does not know – and most of us don’t know what our customers are really thinking. A wiser man does something about it. And a good customer survey is a start.
 Chuck Holmes is president of Corporate Strategies Inc. He has been assisting distributors in improving sales, sales management and customer service for more than 30 years. He can be reached at cholmes@corstrat.org.
This article originally appeared in the Nov./Dec. 2012 issue of Industrial Supply magazine. Copyright 2012, Direct Business Media.


