

 |
by Mike Hockett
A ONE-YEAR “NORMALCY” REPRIEVE
Since our lists are based purely on 2024 fiscal revenue for all distributors, that year is worth examining from a high level.
After riding the inflation wave in 2021 and 2022, distributors saw that tailwind weaken throughout 2023, and it was essentially a non-factor in 2024. Year-over-year comparables finally leveled off in 2024, and in a way, that made it feel like the first “normal” year for wholesale distribution financials for the first time since 2019 with no one single factor heavily influencing figures broadly.
Heading into 2024, analysts had predicted a palpable industrial supply demand slowdown, and that forecast pushed further and further into the year and never really materialized aside from pockets of it.
However, demand expectedly slowed in the fourth quarter as the U.S. general election loomed and President Trump’s election infused rampant economic uncertainty over how his administration’s trade policies would play out. 2025 has been anything but normal.
U.S. wholesale distribution revenue finished at $8.076 trillion – a new annual record for the industry – up 2% compared with 2023. That’s not a gangbusters year by any means, and it trailed U.S. GDP annual growth of 2.8%, but it was within the long-run average of modest growth. Exemplifying distribution’s fragmentation and diversity, certain industry sectors saw excellent 2024 growth (electrical & electronics +11.4%; pharmaceutical +8.2%), while others saw considerable decline (agricultural -12.1%; metal service centers -10.1%).
The vast majority of the distributors on our lists posted annual sales gains in 2024, and tariff-driven market uncertainly led to inventory front-loading during 1Q25 as manufacturers and distributors looked to stockpile goods before higher import levies took effect. As of mid-May, MDM expects overall, annual industry revenue to increase 3.3% in 2025, followed by stronger 4.6% growth in 2026.
|
|

 |
INDUSTRY-SPECIFIC REVENUE
Like for the past several years, this is the most important part of this introduction. Starting in 2022, MDM put a heightened emphasis on ranking companies by their sector-specific revenues rather than total revenue.
This also explains why you’ll see some distributors with smaller total revenues ranked higher than others within the same industry.
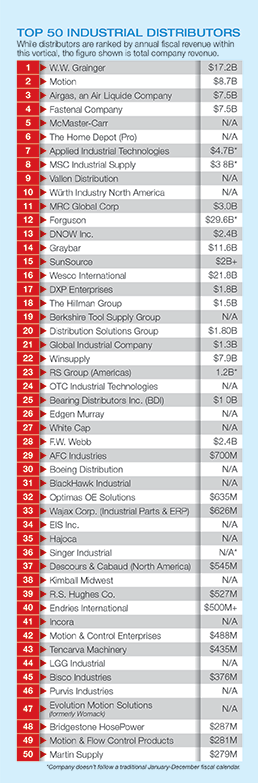
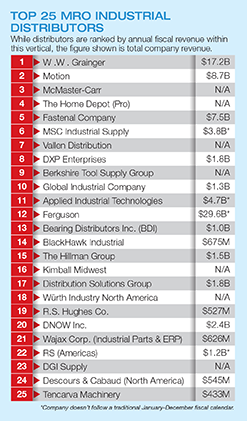
Take Grainger, for example. By its total 2024 revenue of $17.2 billion, Grainger is North America’s largest industrial supplies distributor. But when digging into its financial reports and product sector breakouts, we find that it’s also one of North America’s top distributors of electrical, HVACR, plumbing, power transmission, fluid power, and safety products. This is why Grainger appears on 10 of our 20 sector lists – the company’s revenue within each of those segments is large enough to warrant a spot. And this is why Watsco is ranked No. 1 in HVACR and Grainger is No. 5. Despite Watsco’s $7.6 billion revenue being much smaller than Grainger’s, Watsco’s HVACR revenue was much higher than Grainger’s.
This explains why you’ll find some companies charted on industry lists outside of their “core” offering. For example, Graybar is best known as an electrical products distributor, but its industrial products sales were large enough to chart at No. 14 on our Industrial Supplies list. It’s also why Ferguson appears on our lists for Industrial Supplies, Building Materials/Construction and Safety, besides its hallmarks of Plumbing, HVACR and Industrial PVF.
But while our rankings are based on 2024 revenue within each sector, the revenue you see displayed on our lists is overall revenue. Why? Quite simply, while many privately-owned distributors elected not to publicly share their total revenues, far fewer elected not to publicly share their sector-specific revenues. If we displayed the sector-specific revenues of those that gave us the OK to, they’d be few and far between. The overall revenue figure gives us something to show for the majority of companies on our lists.
That sector-specific revenue breakout is the most painstaking part of our research process, as it involves an incredible amount of hair-splitting and triangulation to find accurate revenues. It makes this feature all the more challenging, but we do it because it results in a more accurate list and levels the playing field.
OUR RESEARCH PROCESS AND METHODOLOGY
MDM’s Top Distributors Lists were based on 2024 fiscal revenues within industry sectors, either reported or estimated by MDM’s editorial team and sector validators. For distributors that don’t follow a January-December fiscal calendar, we’ve noted that with an asterisk and a footnote. To normalize the way we display the rankings, we include total company revenues, rather than breaking out individual sector revenues. Companies were asked to provide data about revenue, with information supplemented by quarterly fiscal reports, SEC filings and publicly available information. For companies that elect to not share revenue data, MDM estimates their relative position in its sector list based on the best available industry resources and information.
Note: Companies that operate primarily as master distributors are not eligible for Top Distributors inclusion.
 |
TO KEEP IN MIND
As you peruse our rankings across these different verticals, it’s important to remember that the way we put them together is not an exact science. Our editorial team made every effort to extract revenue information from the non-publicly-traded distributors listed here, but many companies are understandably private with that information. We are happy to keep their revenue strictly private and only use it internally for rankings, which a number of companies opt for each year. So, when you see “N/A” listed for revenue, that likely means that revenue figure was confidentially given to MDM and to not be published.
Even with that understanding, a smaller number of companies would rather not budge on sharing their revenue at all. Given the amount of large distributors that have been privately-acquired in recent years, this isn’t a surprise. In these cases where revenue isn’t shared, our team triangulates with respected industry experts and the best available information to estimate and rank distributors appropriately.
Another nugget to note is that since we used fiscal 2024 revenue for all companies, the revenue of a handful of companies that don’t follow a traditional 12-month fiscal calendar represent a time difference by as much as nine months. We’ve denoted distributors that don’t follow a traditional fiscal calendar with an asterisk next to their revenue and a footnote for that.
 |
Mike Hockett is executive editor of Modern Distribution Management. He can be reached at mhockett@naw.org.
This article originally appeared in the September/October 2025 issue of Industrial Supply magazine. Copyright 2025, Direct Business Media.
INDUSTRIAL SUPPLY MAGAZINE


The May/June issue of Industrial Supply magazine features an in-depth cover story about GHX Industrial. Plus, we're featuring articles by contributing writers Dr. Bharani Nagarathnam and Frank Hurtte, as well as interviews with numerous product and distribution industry experts.