Distribution Pricing: Current Pricing Models and Their Practical Application
Part 2 of 2
by Scott Benfield

Our earlier articlei introduced the concept of service quality and pricing strategy to distributors. Without understanding how quality of service affects pricing policy, it is quite easy to lose share to competitors with a stronger service-value-to-price ratio. In this article, we will introduce different pricing mechanisms that are used to help distributors determine where prices can be increased. These mechanisms all use current pricing history from the distributor’s database. Some mechanisms, however, are decades old, founded on simplistic ideas or nearly impossible to use in markets with multiple demographics. The pricing models that will be examined are price/volume (scattergram) analyses, pricing pocket waterfalls, and scaling logic by transaction type or transaction type within a segment.
Price / Volume Analyses
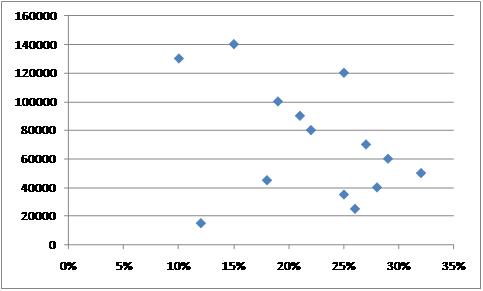
The simplistic logic in most distribution circles is that the best price should be given to the customer who buys the most. In essence, the largest customer pays the lowest margin and, hence, it should be relatively easy, by account, to plot sales versus margins and get a linear relationship between price and volume. In Exhibit 1, 14 accounts are listed for our mock wholesaler, Queen City Supply of Charlotte, N.C. The vertical axis shows the sales revenues of the account in a year, and the horizontal axis lists the margin percent of sales for the same accounts. The proponents of price volume analyses would argue that there should be a relationship between the sales volume of an account and the margin percent of sales. The logic is straightforward and appeals to an uncomplicated desire to set prices based on account volume and gross margin percent.
 |
| Exhibit 1 |
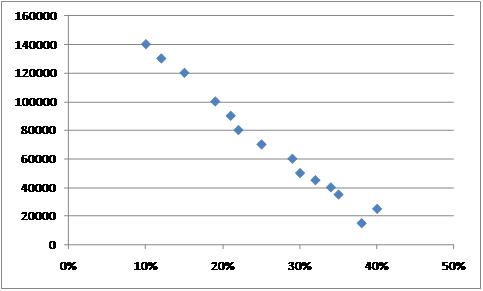
The ideal price volume relationship is found in Exhibit 2 below where Queen City management has lined increasing volume with decreasing gross margin percent and sales volume. In short, there is a linear relationship between price (gross margin percent) and sales (volume) for an account’s entire purchases and this can be planned and appropriate pricing action taken. In the Exhibit below, to make linearity work, we had several accounts in the $40,000 range with margins of 25% to 30% that went to 40%.
 |
| Exhibit 2 |
Our advice on price / volume pricing is that it is far too simplistic and hence errant in helping to drive distributor pricing. While the logic has quick appeal, it does not represent a usable framework for strategic pricing. Our objections to the mechanism are many, however, the major objections, based on our decade of work in distribution pricing are:
- Pricing is influenced by numerous variables outside of sales volume, including type of account (segment), geographic competitors, cost to serve, mix of transactions, and size of transaction.
- Sales and gross margin percent are weak metrics on which to gauge an account’s pricing. They are not indicative of the ability of the account to contribute to operating profit and we often find accounts that have high sales and healthy margins but their service costs exceed their margin dollars.
- Price to volume relationships, at the account level, is impractical and pricing has to get to the transaction or SKU level to be effective. Attempts to drive overall account margin to a linear relationship with volume are crude and often fail.
Our belief is that while the price to volume relationship is appealing logic, it has problems with practical application in that it simply is not detailed enough to provide a comprehensive understanding of how, when, where, and how much to change pricing.
Pricing Pocket Waterfalls
An appealing logic for account pricing is done with a group of analyses titled pricing pocket waterfalls. The idea was made popular by various large consulting firms that developed pricing practices in the last decade or so. A pricing pocket is determined by taking all discounts for an account and creating groupings or “pockets” with the data. Suppose that fictitious distributor Queen City Supply was reviewing the net discounts for accounts including pricing discounts from list, payment discounts, special buy discounts, and annual rebates. For example, the Lake Norman Companies purchased $50,000 at a 32% margin (68% discount from list) plus had payment discounts of $3,000, special buy discounts of $4,000, and annual rebate of $2,000. Normally, Lake Norman Companies would be evaluated on their margin percent or generated margins of $16,000, however, the additional discounts bring the net margins, inclusive of discounts, to $7,000. Granted, some of the discounts such as payment are ostensibly offset by interest income, however, they are substantial and change the profitability of the account. For instance, the use of price discounting is sometimes indicative of the account “cherry-picking” the supplier for specials and not giving the bulk of the purchases to the supplier offering the discounts.
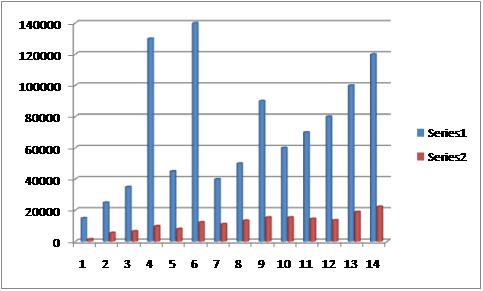
In Exhibit 3, we have taken the margin dollars produced by the accounts from Exhibit 1 net of discounts and rebates and put them in bands of their net “contribution” before operating expenses are applied. In the exhibit, the blue bars (Series 1) represent the sales of the account and the red bars represent net contribution (Series 2). The pockets or groupings are found between accounts 1-3, 4-7, 8-12, and 13-14. For the most part, the groupings have a noticeable rise and fall in the red bars where the average of the group is noticeably greater than the preceding group. These “pockets” or “pocket margin bands” can be used to help develop both pricing and other policies to work with individual accounts that are problematic. In the exhibit, account No. 4 has substantial sales but a very low contribution compared to its sales volume. It is said to have a large “waterfall” because the sales to contribution difference is significant.
 |
| Exhibit 3 |
An account with a smaller waterfall is No. 7 where sales are slightly less than $40,000 but net contribution is around $10,000.
Pricing pocket waterfall analyses are a more exacting technique than the price/volume analysis. Reviewing margin dollars after discounts and specials is a great help in understanding the profitability of a particular account. For distribution, however, our experience is that the analytical framework is of limited use unless one considers service costs or operating expenses as applied to the account base. Since distribution is a thin margin enterprise, it is imperative to have operating expenses included in customer, branch, transaction and seller analyses for pricing purposes. Some of the literature regarding pricing pocket analyses advises including operating expenses in the pricing decisionii but the cost allocation logic is, to us, suspect as it resembles activity costing which has, in large part, been recanted by its chief proponent.iii
Both price / volume and pricing pocket waterfall analyses focus on the account as the primary entity to secure pricing gain. While the account is one variable from which to drive pricing gain, there are other ways to codify customers and transactions to drive pricing gain. Since distributors serve thousands of customers, customized pricing for each customer becomes time consuming, error prone and difficult to maintain. Because of the limits of the account-centric approach to pricing, we advocate a segment and transaction approach and illustrate them in the next section.
Scaling Logic for Pricing Utilizing Marketing Segments and Transaction Types
A fundamental concept to realizing pricing gain is that of the reference price. The reference price is the relative familiarity of the buyer with a “fair” or “market” price of the item. For most purchases, the reference price is a function of the amount of times the buyer purchases the item and its sales volume. The more the buyer purchases the item, the more they have a “market” price in their gray matter and can recall it. The less frequently an item is ordered and less its sales, the less there is a pricing reference and the less price sensitive the item. And, the less price sensitive an item, the easier that item is available for maximizing pricing gain.
The historic problem with reference pricing, in distribution, is that there are literally thousands if not tens of thousands of items sold to thousands of customers. To customize pricing for each of these items is an impossible job. Some methods of classification need to be engaged and we advocate transaction types and segments as reasonable and valid codification methods for pricing purposes.
Transaction Types
Most distributors are familiar with the different types of transactions including stock sales, counter sales, non-stock sales, and direct (drop) shipments. These transactions have their reasons for being, and transactions have unique attributes that suit them well for pricing including:
- Transactions are identifiable entities with unique costs and revenue profiles
- Transactions either make money or they don’t. Allocating operating costs to transaction types is a straightforward exercise.
- Transactions are actionable since they are identifiable
For the purposes of this article, we will review two common transactions including the stock order and non-stock order.
Stock Transaction Pricing
Stock transactions are the most common order type processed by distributors. Typically, stock transactions represent 50% to 75% of all orders in a given time period. Not all stock transactions are the same, however, and there needs to be a means of classifying stock transactions before pricing analyses can be undertaken. Fortunately, classic industrial marketing has a means of driving pricing with a codification logic called the segment. For all intents and purposes, a marketing segment is a group of customers with common needs. Segmenting customers allows the firm to personalize product and service offerings without the excessive cost and error prone activity of individual customization.
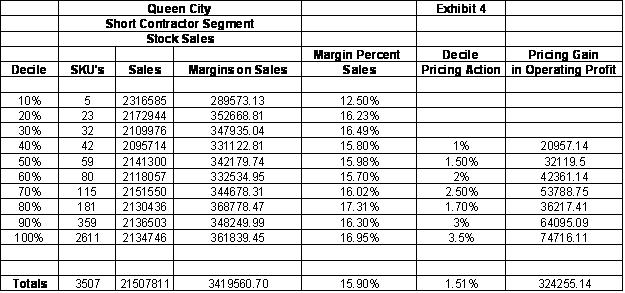
For distribution pricing, we recommend segmenting accounts and then initiating scaling analyses on segment purchases. Scaling is a methodology of reviewing numerous SKU purchases by segment within a time period. In Exhibit 4 below, 3,507 stock SKUs and their sales history in the Short Contractor segment have been captured for a year. The SKUs were ranked by sales volume for the period and then aggregated into each 10% of segment sales called deciles. For instance, the first decile has sales of 2.31MM with five SKUs at an overall 12.5% gross margin.
 |
| Exhibit 4 |
This decile analysis allows pricing managers to look at a large number of SKUs (3,507) within a segment and gauge opportunity for pricing gain. In the exhibit above, the pricing opportunity is found in the 40% decile and above. Why? The margin percent of sales “flattens” as SKUs increase and sales per SKU decrease. As sales of an item decrease, the firm should make a higher gross margin. A pricing plan for Queen City has been proposed under the column Decile Pricing Action. For example, the 80% decile has been selected for a 1.7% pricing increase which would net an additional $36,217. For the entire segment, the proposed increases net $324,255.
The decile analysis helps Queen City managers understand if margins scale or rise as the sales per SKU fall. The analysis is a type of scaling test to understand which objects are less price sensitive. In the exhibit above, the lower deciles don’t scale upwards as sales per SKU fall. This is typically an example of cost-plus pricing and a behavioral pricing impediment called the Upper Limit Theorem which states that once a cost-plus multiplier is used for the most price sensitive products, it tends to be repeated for all product sales.iv
Non-Stock Pricing
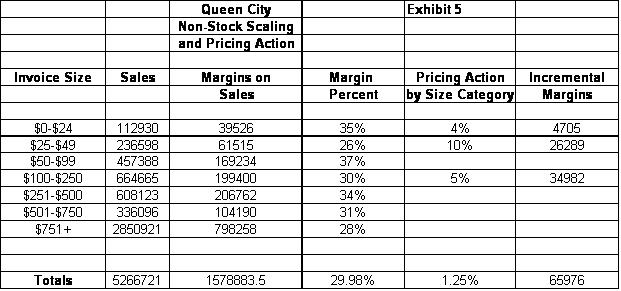
Non-stock items are inventory sold to customers that are not stocked but ordered and processed through the warehouse. The problems with non-stock products are numerous, including expensive processing, shrinkage or loss from non-standard warehouse placement, and high returns and warranties from unfamiliarity with item(s). Our work in non-stock pricing finds that most of these items lose money as they are small order size and the margins earned cannot cover the loss from processing costs. However, it is possible to price non-stock sales using scaling logic and get a higher margin. It is also important to remember that non-stock sales are typically price sensitive to the size of the order and not the type of product. Since non-stock products, by definition, are not stocked they do not have a readily available reference price. Below is a non-stock scaling analysis and pricing recommendation for Queen City Supply.
 |
| Exhibit 5 |
In Exhibit 5, Queen City management has scaled the non-stock orders by size of invoice for the most recent year. The analysis shows that non-stock margins start at 35% for the smallest order sizes and scale downward as the order size rises above $750. However, there are size ranges $25-$49 and $100-$250 where the overall margins are abnormally low and Queen City management is raising prices in these categories as well as a 4% increase for the smallest non-stock orders. The pricing actions will net $65,976 in incremental margins.
Typically, non-stock orders are expensive to process and most distributors don’t make money on these items until the invoice size is somewhere north of $300. For many of the size categories listed in Exhibit 5, there is a high likelihood that the orders for Queen City lose money, however, maximizing pricing gain reduces loss and this makes the transaction(s) less unprofitable.
Future of Distribution Pricing
Our work in pricing is ongoing. It is a much misunderstood subject in distribution and some of the current “knowledge” is antiquated including price/volume analyses for accounts and account based analyses. A sound pricing policy includes reviewing accounts, SKUs, segments, transaction types, and services for pricing gain. An account only focus is both simplistic and limiting. Our future work will be done in the areas of transaction costing and pricing implications and using pricing as an inducement to drive larger sized transactions and more profitable types of transactions. The analyses, structures, and understanding of how to use price to drive operating income will be more complex, but the rewards will be significantly better for those distributors that don’t shy away from the new knowledge.
Scott Benfield is a consultant for distributors and manufacturers in B2B channels. He is the author of five books and numerous articles on marketing and sales issues. He has over a quarter century in management, including executive duties in leading Fortune rated companies and top distributors. He has undergraduate and graduate degrees from Wake Forest University. His agency, Benfield Consulting, is located in Chicago and can be reviewed at www.benfieldconsulting.com. Scott can be contacted at (630) 428-9311 or bnfldgp@aol.com.
i. Benfield, S. "Distribution Pricing: Why Velocity Pricing and Service Fees Won't Necessarily Work in the New Economy," Industrial Supply magazine Web site, Oct. 2009
ii. Marn, M., Roegner E., Zawada, C., “The Power of Pricing,” page 34, The McKinsey Quarterly, 2003, Number 1
iii. Benfield, S., Griffith, S. “Why is Wholesale Distribution a Low Profit Business?” White Paper by Benfield Consulting at www.benfieldconsulting.com
iv. Benfield, S., Baynard, J. “Pricing Management for Distributors,” pg. 100, LNC Press, 2001


