


Out of the Fire: Repositioning Independent Distribution
Part One: The Wisdom of Fire
by Neil Gillespie and Allen Ray
As Billy Joel said, “We didn’t start the fire. No, we didn’t light it but we tried to fight it.”
Before fire intervention techniques were introduced to the Long Island Pine Barrens of Suffolk County, N.Y., fire would break out every 15 to 25 years. Before that, the fires would naturally eliminate weaker trees and brush. Fire resistant, well-rooted trees prevailed. In 1995, despite intervention efforts, a really nasty fire dubbed “The Sunrise Wildfire” ravaged the Pine Barrens and threatened bordering commercial property.
An expert attributed that event to fire intervention, which allowed too many weak trees to survive over the years. He argued that the forest would have been better off if the “pitch pine,” a particularly fire-resistant species, was allowed to dominate and weaker trees left to perish in the fires. The Barrens also sit on top of the major drinking water aquifer for Long Island.
The tragedy of our current economic situation is like that of the fire. Economic intervention represented by liberalized credit, relaxed financial regulation and political stimulation of housing demand created an unsustainable “bubble” with huge risk to the financial system. Underlying mortgage loans ignited, spreading to their parent mortgage-backed securities (MBS), then to the credit default swaps “insuring” the MBS bonds.
Financial institutions worldwide were up to their necks in each other’s credit default swaps, so they were all holding guns to each other’s heads. Then they held a gun to our heads by getting Congress to approve TARP bailouts. We fought the fire, creating more “flammable” assets from unsustainable debt.
Tragedy or Teacher?
Instead of looking at the “fire” as a tragedy, let’s learn from it. Sustaining profitable growth over the years is about extensive roots, a strong productive core business and about distributing “seeds” to grow in new places close enough to the tree. We’ll explain how this works in our three part series. Let’s get to the survey results for now.
 Survey Results: Hope from Understanding
We recently surveyed multiple distribution channels about what they did to make it through the recession and what they need to do now. Distributors want to dig out of the rubble, but are reluctant to invest in growth until the national picture clears up. We suspect they would rather be sure about the devil they’re dealing with before betting the farm all over again. A few distributors looked like they were “on” to something, looking at their businesses as a number of “niches.” There’s hope in that line of thinking, and we will build on that in this series.
Let’s get our bearings. We asked distributors, (primarily owners and C-Level personnel) from industrial, electrical, safety, HVAC and a few other trades to participate. We received a broad spectrum of responses with good representation from each channel. We asked them to report their sales and market performance variances from 2009 over 2008. We further divided these into good performers (-5% and better) and poor performers (-20% or worse). Some of the analyses report what the good performers did vs. poor performers.
These are the major findings from our survey:
1) Past growth was largely artificial: the new planning baseline is -20% or worse.
2) Distributor reactions were primarily defensive.
3) GP%, inventory turns, receivables performance slipped a bit, net profit a lot.
4) Good performers tend to be realists vs. unbridled optimists.
5) Good performers looked deeper for answers and in more places.
6) Surprise: good performers cut more salespeople. What do they know?
7) Everyone is afraid of “the weather” (the nation’s direction).
8) Growth opportunities: the usual sources won’t deliver, the new sources are still “suspect.”
9) Distributors need to broaden their growth horizons while improving productivity to turn gross margin into profits at an increasing rate.
10) Manufacturers executed their usual tactics to curtail expenses.
DIVING IN TO EACH
1) The New Planning Baseline is -20% or Worse
The mode of reported sales decline from 2009 vs. 2008 was minus 20% to minus 29%. The mode of market decline was closer to 30-35%. Naturally, most distributors want to believe they did better than the market and will report this. But let’s not split hairs. It was really bad, the worst decline of our lifetimes. There are few tricks left in the government’s bag of fiscal and monetary tools to change things for the better. Bernanke and Geithner are out of ammunition.
Much of the growth you enjoyed from 2003-2008 was artificially stimulated and irresponsibly financed so, hence, unsustainable. The result is that your market shrunk back to 2003 levels, so your new planning baseline is 20% down or more. You’ll have to grow from there by doing things differently from what you’ve ever done before. Don’t act like a surfer waiting for the big waves to return. Look for more beaches.
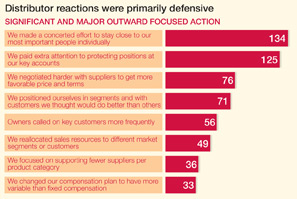 2) Distributor Reactions Were Primarily Defensive
It’s natural to retreat and protect your own backyard when threatened. Thieves go on the prowl when the economy declines. So the first move you make before venturing farther is to “get your rear elements in order”: protect your own accounts by paying more attention to them. Notice that distributors tended to do less as the suggested actions became more outwardly focused and strategic vs. tactical.
That is to be expected. The upper 5% that substantially outperforms the rest takes the trouble to understand and execute the tougher strategies that have the higher upside potential. Everybody needs to start with protecting key accounts, though.
Conclusion: Learn more ways to grow than just concentrating on existing accounts and paying more attention when threatened. Pay more attention to opportunities to add value and penetrate different segments when sales are healthy before you need to panic in a recession. The high performers executed strategies in more directions in response to the recession.
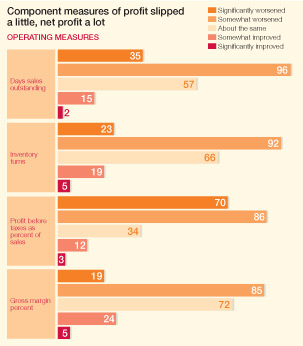 3) Component Measures of Profit Slipped a Little, Net Profit a Lot
Distributors reported that their Gross Profit Rates, Inventory Turnover and Receivables Collection Rates slipped a bit, but Net Profit slipped much more. On further analysis, this reveals thin understanding or practice of “scalability.” Companies that simply added people during the recovery of 2003-2008 vs. automating processes with technology did nothing to flatten the variable cost line in their break-even chart. The difficulty in a deep recession is that it’s a lot harder to unravel people from work processes on the way down. You add people on the way up to perform one role. They end up performing more roles than expected. When you need to cut, you often cut things you may not want to cut. Customers end up disappointed and your team gets irritated as they scramble to fill the holes.
When you substitute fixed investment like technology for variable cost (headcount) you gain “operating leverage,” meaning net profit percentage increases with volume due to the reduced slope of the variable cost curve. During 2003-2008, distributor Net Profit percentages probably went up with the little bit of operating leverage they had. If they had automated more back in 2002-2004, they would have taken more of their sales growth home as net profit.
Conclusion: Productivity and scalability are critical. Don’t grow sales without them.
4) Good Performers Tend to Be Realists, Not Unbridled Optimists
More good performers reported that they saw the recession coming. In addition, they either predicted its severity or predicted it would be worse. They prepared for the worst and then some, but also took more initiative to get out on the front to grow sales. Their realism flies in the face of the usual tendency to exhibit unbridled optimism, the kind that says, “There’s a recession on but I’m not participating.”
Our results show that the opposite works better. Better performers face the recession and adjust resources intelligently while executing more than a defensive strategy to protect customers. You wouldn’t be impressed with the percentage difference between good performers and poor performers on individual actions. The difference is that good performers took greater action and in more areas.
Trees grow primarily at the tips of their branches. Prolific growers do it by putting out more buds. The better performers tend to do this, but they could mature their skills to pursue a broader set of growth opportunities and simultaneously drive greater productivity. How many distributors are investing time investigating what is going on at customers and prospective new segments, which are at the “tips of their branches”?
Conclusion: A fire’s a fire. Be realistic, cut off the burning parts fast, and get out on more growth fronts.
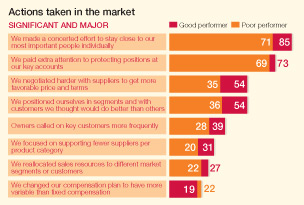 5) Good Performers Looked Deeper
Both groups focused on staying close to best accounts and best people, but then it gets interesting right there on the above chart.
By a wider margin, better performers tended to negotiate with suppliers more, and approached how they stayed close to customers differently. They didn’t just focus on key customers by volume. They thought about a customer’s business prospects and business segments that had a better chance of weathering the storm, maybe even growing through it. Just like they were realistic about what they thought would happen with the economy and responded appropriately, they applied this to how they looked at customers and looked beyond today into tomorrow.
Conclusion: As Wayne Gretzky said: “I don’t go where the puck is, I go where I think the puck is going to be.” How can you improve on what good performers did? How about predicting which segments will fare better than others, and adding more customers there?
In Part II:
We also discovered that good performers cut more salespeople and you’ll really want to know why. In addition, distributors have issues growing on multiple fronts as well. The old sources of growth probably won’t deliver this time, so everyone will have to look in different places. Where? Will the new technologies deliver growth? What can be expected? See what distributors said and what we think as well.
Till then, we recommend that you do some research on tree growth, including “meristems.” You will be amazed at how this analogy could apply to your business.
 Neil Gillespie is a veteran distribution consultant, speaker and author. Neil worked for GE and Eaton corporations before launching his distributor consulting practice in 1995. He helped Roden Electrical Supply of Knoxville grow more than 500% over 11 years, while more than tripling EBITDA percentage. Neil has distilled his profitable growth methods in his Eight Steps to Breakthrough Growth. His book “Discover Your Core, Then Go For More” is now available. Contact Neil at neilg@shamrockgrowth.com.
 Allen Ray has 45 years of experience as a distribution business owner, information systems, marketer of product data and consultant to wholesale distributors. Allen advises clients on strategies to stop “Profit Leakage” and create a scalable business that returns an increasing percentage of gross margin dollars to net profits. Allen is collaborating with Neil to help distributors adopt the Eight Steps to Breakthrough Growth, providing expertise in “Leadership Productivity” and “Pricing for Maximum Gross Profit Dollars per Order.” Contact Allen at allen@allenray.com.
This article originally appeared in the Jan./Feb. 2010 edition of Industrial Supply magazine. Copyright 2010, Direct Business Media, LLC.
INDUSTRIAL SUPPLY MAGAZINE


The July/August issue of Industrial Supply magazine features an in-depth cover story about Global Industrial. Plus, we're featuring articles by contributing writers Dr. Bharani Nagarathnam and Frank Hurtte, as well as interviews with numerous product and distribution industry experts.